Pictures...
Old homework
Contact info
Info sheet
Some links
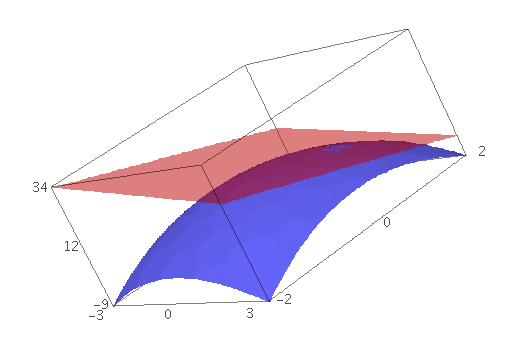
- The surface z = 12 - x2 -
3y2 and its tangent plane at the point (1, 1,
8):

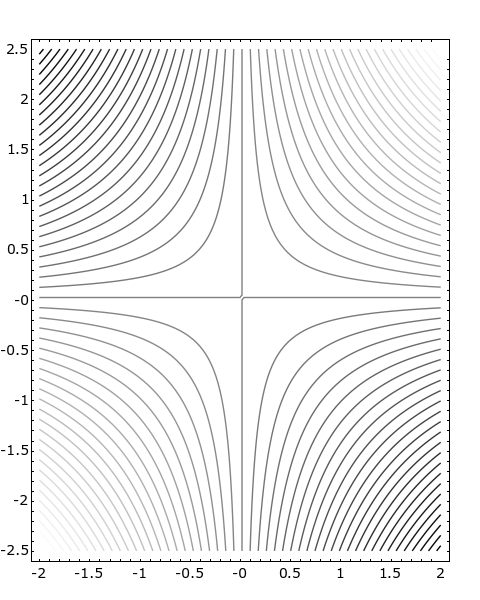
- Contour lines for the surface z = xy:
- Here is the Sage code for the Taylor
approximations to the sine curve (from class on 10/24):
var('x')
x0  = pi/4
f   = sin(x)
p   = plot(f,-pi,3*pi, thickness=2)
dot = point((x0,f(x0)),pointsize=80,rgbcolor=(1,0,0))
@interact
def _(order=(1..12)):
  ft = f.taylor(x,x0,order)
  pt = plot(ft,-pi, 3*pi, color='green', thickness=2)
  html('$f(x)\;=\;%s$'%latex(f))
  html('$\hat{f}(x;%s)\;=\;%s+\mathcal{O}(x^{%s})$'%(x0,latex(ft),order+1))
  show(dot + p + pt, ymin = -1.5, ymax = 1)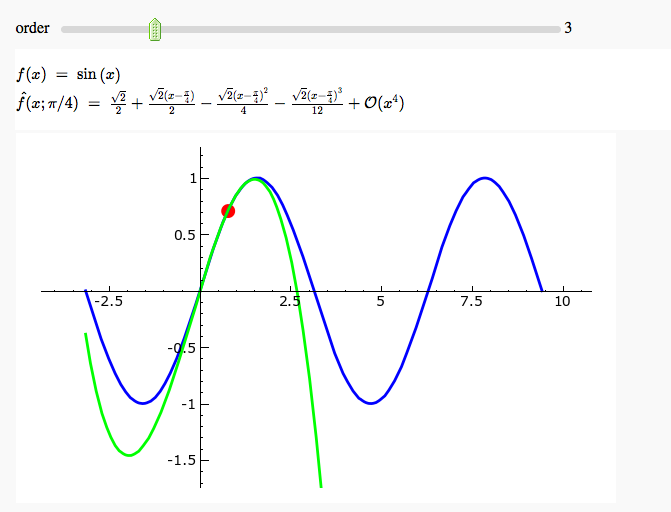
- Here is one version of the Sage code
for the Taylor approximations to the surface (from class on
10/24). Parts of this are very slow, in particular computing the
various partials to get the coefficients for the linear and
quadratic approximations. Warning: this makes it almost unusable, in
my opinion.
var('x y') F = sin(x^2 + y^2) * cos(y) * exp(-0.5*(x^2+y^2)) plotF = plot3d(F, (x, 0.4, 2), (y, 0.4, 2), adaptive=True, color='blue') @interact def _(x0=(0.8,1.6), y0=(0.8, 1.6), show_plane=("Show linear approximation", False), show_quad=("Show quadratic approximation", False)): F0 = F(x0, y0) P = (x0, y0, F0) dot = point3d(P, size=15, color='red') plot = dot + plotF if show_plane or show_quad: F1 = derivative(F,x)(x0, y0) F2 = derivative(F,y)(x0, y0) plane = F0 + F1 * (x-x0) + F2 * (y-y0) plane_string = 'z = %.2f + %.2f(x-x_0)+%.2f(y-y_0)'%(F0, F1, F2) if show_plane: plot1 = plot3d(plane, (x, 0.4, 2), (y, 0.4, 2), color='green', opacity=0.7) plot += plot1 if show_quad: F11 = derivative(F, x, x)(x0, y0) F12 = derivative(F, x, y)(x0, y0) F22 = derivative(F, y, y)(x0, y0) quad = plane + 1/2 * (F11 * (x-x0)^2 + 2 * F12 * (x-x0) * (y-y0) + F22 * (y-y0)^2) quad_string = plane_string + '+ \\frac{1}{2} \\left((%.2f) (x-x_0)^2 + 2(%.2f) (x-x_0)(y-y_0) + (%.2f)(y-y_0)^2\\right)'%(F11, F12, F22) plot2 = plot3d(quad, (x, max(0.4, x0-0.5), min(2.0, x0+0.5)), (y, max(0.4, y0-0.5), min(2.0, y0+0.5)), color='purple', opacity=0.7)) plot += plot2 html('$F(x,y) = e^{-(x^2+y^2)/2} \\cos(y) \\sin(x^2+y^2)$') if show_plane: html('tangent plane: $%s$'%plane_string) if show_quad: html('quad approx: $%s$'%quad_string) show(plot) - Here is another version of the Sage code
for the Taylor approximations to the surface (from class on
10/24). This is much faster, but requires using the (as yet
unreleased) version 3.2-alpha0 of Sage.
var('x y')
var('xx yy', ns=1)
G = sin(xx^2 + yy^2) * cos(yy) * exp(-0.5*(xx^2+yy^2))
def F(x,y):
    return G.subs(xx=x).subs(yy=y)
plotF = plot3d(F, (0.4, 2), (0.4, 2), adaptive=True, color='blue')
@interact
def _(x0=(0.8,1.6), y0=(0.8, 1.6), show_plane=("Show linear approximation", False), show_quad=("Show quadratic approximation", False)):
    F0 = float(G.subs(xx=x0).subs(yy=y0))
    P = (x0, y0, F0)
    dot = point3d(P, size=15, color='red')
    plot = dot + plotF
    if show_plane or show_quad:
        F1 = float(G.diff(xx).subs(xx=x0).subs(yy=y0))
        F2 = float(G.diff(yy).subs(xx=x0).subs(yy=y0))
        plane = F0 + F1 * (x-x0) + F2 * (y-y0)
        plane_string = 'z = %.2f + %.2f(x-x_0)+%.2f(y-y_0)'%(F0, F1, F2)
    if show_plane:
        plot1 = plot3d(plane, (x, 0.4, 2), (y, 0.4, 2), color='green', opacity=0.7)
        plot += plot1
    if show_quad:
        F11 = float(G.diff(xx, 2).subs(xx=x0).subs(yy=y0))
        F12 = float(G.diff(xx).diff(yy).subs(xx=x0).subs(yy=y0))
        F22 = float(G.diff(yy, 2).subs(xx=x0).subs(yy=y0))
        quad = plane + 1/2 * (F11 * (x-x0)^2 + 2 * F12 * (x-x0) * (y-y0) + F22 * (y-y0)^2)
        quad_string = plane_string + '+ \\frac{1}{2} \\left((%.2f) (x-x_0)^2 + 2(%.2f) (x-x_0)(y-y_0) + (%.2f)(y-y_0)^2\\right)'%(F11, F12, F22)
        plot2 = plot3d(quad, (x, max(0.4, x0-0.5), min(2.0, x0+0.5)),
             (y, max(0.4, y0-0.5), min(2.0, y0+0.5)), color='red', opacity=0.7)
        plot += plot2
    html('$F(x,y) = e^{-(x^2+y^2)/2} \\cos(y) \\sin(x^2+y^2)$')
    if show_plane: html('tangent plane: $%s$'%plane_string)
    if show_quad: html('quad approx: $%s$'%quad_string)
    show(plot)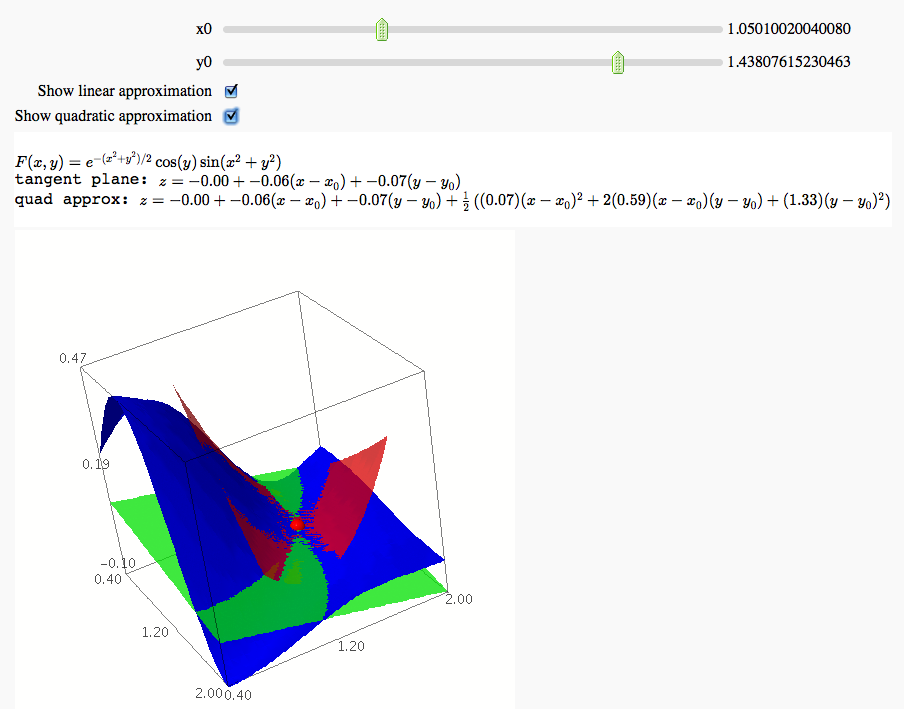
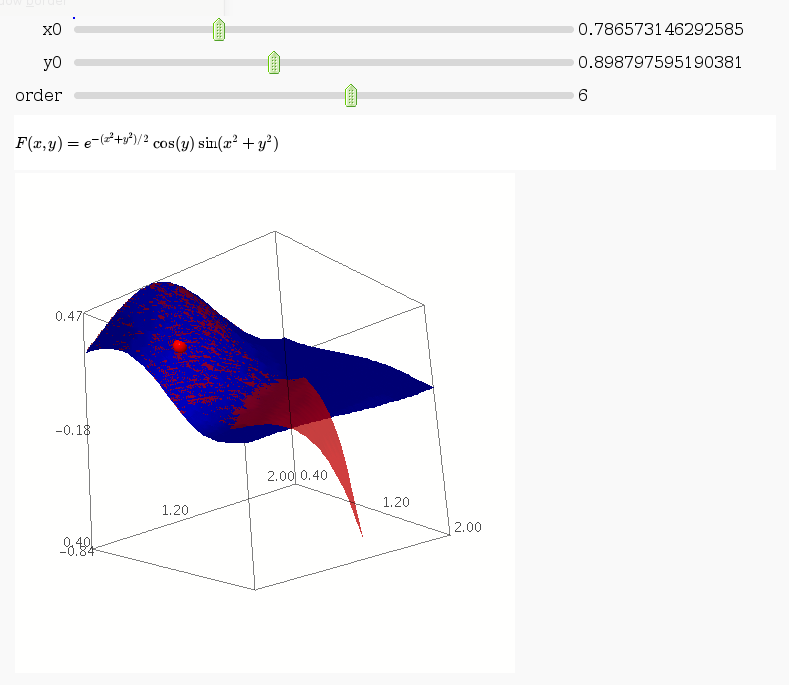
- One more version, again relying on version 3.2 of Sage, which
allows for higher order Taylor approximations:
var('x y')
var('xx yy', ns=1)
G = sin(xx^2 + yy^2) * cos(yy) * exp(-0.5*(xx^2+yy^2))
def F(x,y):
    return G.subs(xx=x).subs(yy=y)
plotF = plot3d(F, (0.4, 2), (0.4, 2), adaptive=True, color='blue')
@interact
def _(x0=(0.5,1.5), y0=(0.5, 1.5),
      order=(1..10)):
    F0 = float(G.subs(xx=x0).subs(yy=y0))
    P = (x0, y0, F0)
    dot = point3d(P, size=15, color='red')
    plot = dot + plotF
    approx = F0
    for n in range(1, order+1):
        for i in range(n+1):
            if i == 0:
                deriv = G.diff(yy, n)
            elif i == n:
                deriv = G.diff(xx, n)
            else:
                deriv = G.diff(xx, i).diff(yy, n-i)
            deriv = float(deriv.subs(xx=x0).subs(yy=y0))
            coeff = binomial(n, i)/factorial(n)
            approx += coeff * deriv * (x-x0)^i * (y-y0)^(n-i)
    plot += plot3d(approx, (x, 0.4, 1.6),
             (y, 0.4, 1.6), color='red', opacity=0.7)
    html('$F(x,y) = e^{-(x^2+y^2)/2} \\cos(y) \\sin(x^2+y^2)$')
    show(plot)