
(I made these plots on the computer in my office; you may be able to reproduce these effects on a graphing calculator or your home computer.)
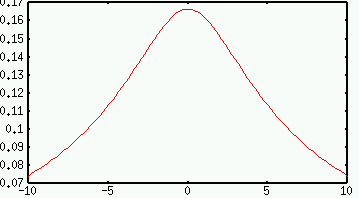
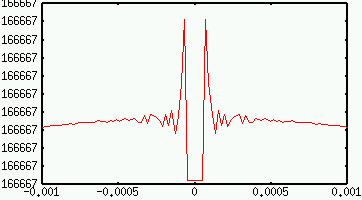
Here are two plots, both of the function (sqrt(x2+9)-3)/x2. Zooming in on the point where x=0 (where there is a removable discontinuity in the graph) leads to the second plot.


It turns out that the first plot is more accurate, but without calculus (or some other tool), it's hard to decide. The corners and other features of the second graph come from inaccuracies in the computer's arithmetic.

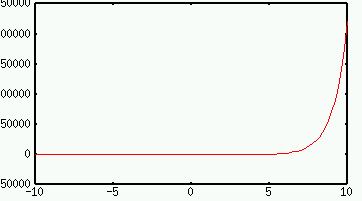
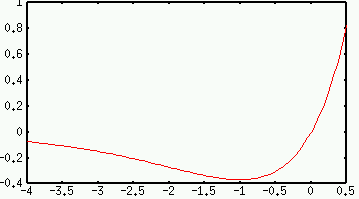
A quick derivative calculation tells me that there is a critical point at x=-1, so I get more detail if I focus in on that:

I might have missed this minimum just using the computer: calculus told me where there was an interesting part of the graph, so it helped me focus my attention. (There is also an inflection point at x=-2, which is visible in the second graph but not the first.)
Back to Math 124 home page.
Go to John Palmieri's home page.
Last modified: Mon Apr 29 12:59:28 PDT 2002