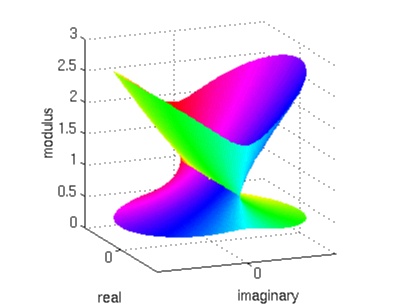
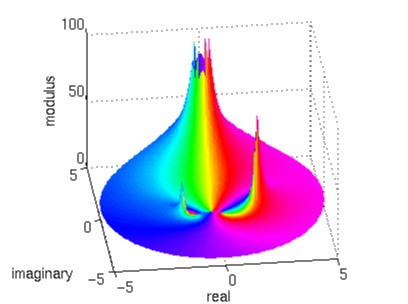
Here are some examples of graphs drawn by ANALYTICPIC:
marshall@math),
who can give you a copy.
pderot3d, which is
part of MATLAB's PDE toolbox.
If you have the PDE toolbox, this is pretty easy to work around: get a
tarred version of ANALYTICPIC (by clicking on the link below). When you
untar the file, you will find a text file called pdechanges.txt,
which details some changes to make to pderot3d. These changes
make pderot3d work a little better for ANALYTICPIC.
If you don't have the PDE toolbox, you'll still be able to use ANALYTICPIC,
but without one of its more useful features: the ability to rotate the
graph using the mouse. If you want to do this, first get a tarred version
of ANALYTICPIC (by clicking on the link below). Then, in the file
drawgraph.m, either remove or comment out the following
line:
if dp==0 pderot3d on; end
ANALYTICPIC should now work for you. You should even be able to change the
viewpoint of the graphs you get, albeit in a clumsy manner, by using
MATLAB's view command.
Currently, ANALYTICPIC has only been tested on Unix. It would be nice to know if it works on other platforms.
Return to Don Marshall's home page.