Here is some python3 code that takes lpsolve output as input and generates tikz code of a chessboard.
# python code to read in an lpsolve output file
# and create a chessboard with the knights specified
#
# this code should be fed the lpsolve output, just the variables part
#
# The output is tikz code that can be added to a LaTeX file to
# create a figure showing the chessboard and knights
#

import re

import sys

resultsFile = sys.stdin.readlines()

#with open(resultsFile) as f:
#    content = f.readlines()

maxX=0
maxY=0

## give size of grid (for an 8x8 board, e.g., use 8-1 here)
maxX=8-1
maxY=8-1
print("\\begin{tikzpicture}[auto,scale=0.4]")
for line in resultsFile:
    if ('x' in line or 'k' in line): # we assume there are two variable types, b and w, for the two types of knights
        a=re.split('_ *',line.rstrip('\n')) # split the line based on underscore or blank spaces, remove newline
        b=re.split(' +',a[2])

		# get integer values from string: coordinates plus the binary indicator
        x=int(a[1])
        y=int(b[0])
        yes=int(b[1])

        if (yes==1): # this coordinate is in the solution
                    # add K to the picture
            # we assume the variables are x and something else
            # but the output is white and black knights
            if ('x' in line):
                print("\\node at (",x+0.5,",",y+0.5,") {W};")
            else :
                print("\\node at (",x+0.5,",",y+0.5,") {B};")

# add grid

print("\\draw[gray] (0,0) grid (",int(maxX)+1,",",int(maxY)+1,");")
print("\\end{tikzpicture}")
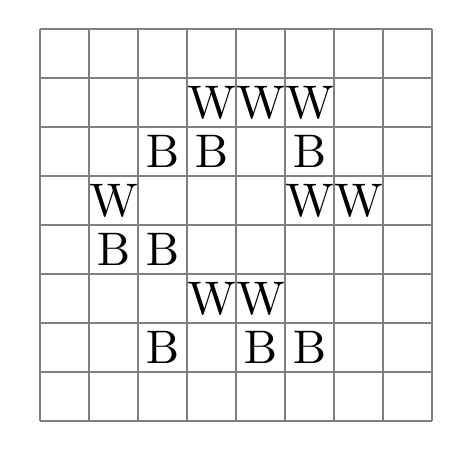
Using this as input:
k_1_3                           1
x_1_4                           1
k_2_1                           1
k_2_3                           1
k_2_5                           1
x_3_2                           1
k_3_5                           1
x_3_6                           1
k_4_1                           1
x_4_2                           1
x_4_6                           1
k_5_1                           1
x_5_4                           1
k_5_5                           1
x_5_6                           1
x_6_4                           1
(saved in a file called sample8x8.txt) we set the board size to 8 in tikzDiagramizer.py and then run it like this:
python3 tikzDiagramizer.py < sample8x8.txtto get the output
\begin{tikzpicture}[auto,scale=0.4]
\node at ( 1.5 , 3.5 ) {B};
\node at ( 1.5 , 4.5 ) {W};
\node at ( 2.5 , 1.5 ) {B};
\node at ( 2.5 , 3.5 ) {B};
\node at ( 2.5 , 5.5 ) {B};
\node at ( 3.5 , 2.5 ) {W};
\node at ( 3.5 , 5.5 ) {B};
\node at ( 3.5 , 6.5 ) {W};
\node at ( 4.5 , 1.5 ) {B};
\node at ( 4.5 , 2.5 ) {W};
\node at ( 4.5 , 6.5 ) {W};
\node at ( 5.5 , 1.5 ) {B};
\node at ( 5.5 , 4.5 ) {W};
\node at ( 5.5 , 5.5 ) {B};
\node at ( 5.5 , 6.5 ) {W};
\node at ( 6.5 , 4.5 ) {W};
\draw[gray] (0,0) grid ( 8 , 8 );
\end{tikzpicture}
Adding this to a LaTeX file with
\usepackage{tikz} in the header,
rendering the LaTeX file will yield this figure: