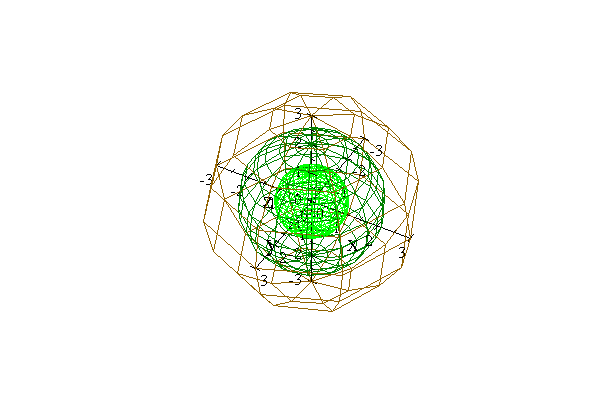
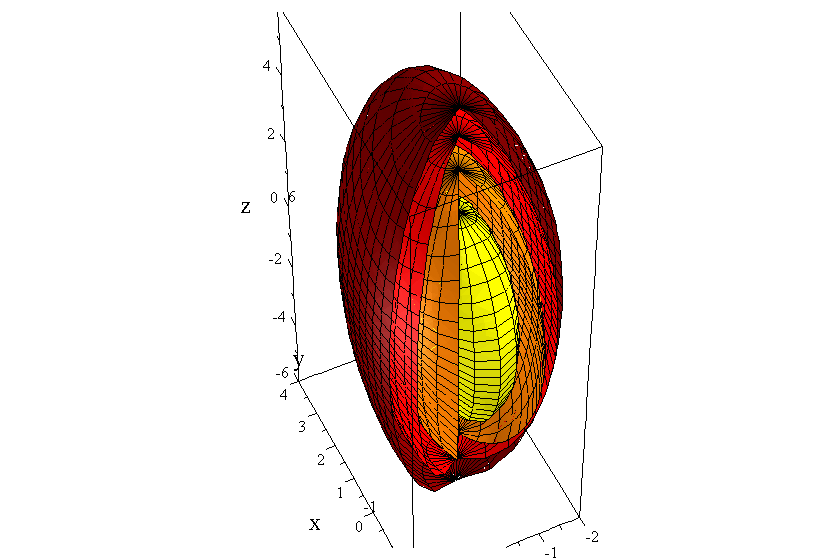
Since we do not have four dimensions to graph such a function, we try to see what it likes by looking at its contours: level surfaces.
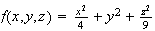
The level surfaces for the function
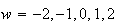
 corresponding to the values
 .
Darker colors are for higher function values.
.
Darker colors are for higher function values.
The ellipsoids are graphed with slices removed so that you can see different layers.
Level surfaces for
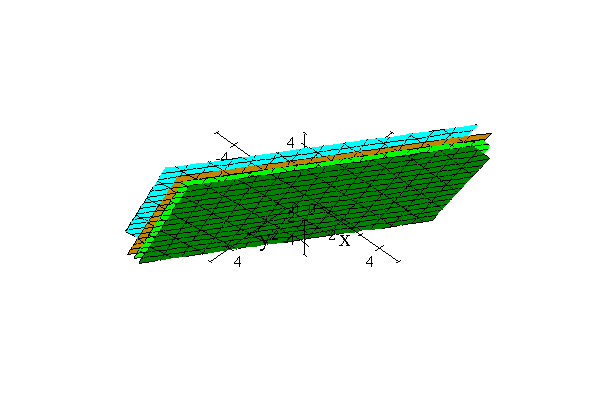
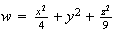
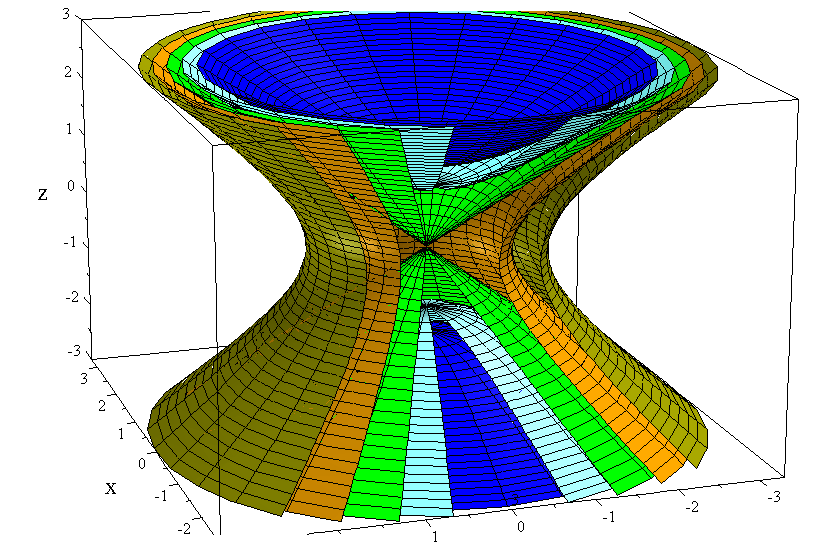
Level surfaces for the function
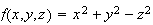 corresponding to the values
 .
.
The coloring is like a map. Green is for
 .
Darker blues are more negative. Darker browns are more positive values.
.
Darker blues are more negative. Darker browns are more positive values.
Again, the surfaces are graphed with slices removed so that you can see different layers.
Level surfaces for

It is not possible to see these on graphs-again 4th dimension problem- but we can say what they are.
 is the rate of change when we move from
 in the positive
 -direction
keeping
-direction
keeping
 and
and
 constant. To calculate
 we treat
 and
and
 like numbers and differentiate with respect to
 with the usual rules of differentiation. Similary, we define
 and
and
 .
.
For a unit vector

 we can calculate the directional derivative
 by
by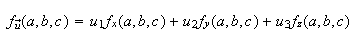
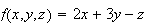
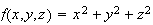
The gradient of
 is the
vector
is the
vector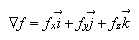
It has the following important properties:
The gradient is a vector in
 -space.

The gradient is always perpendicularto the contours (level surfaces).
The gradient points in the direction of maximum increase for

It's length is the maximum possible directional derivative at that point.
As the contours get closer, the size of the gradient increases.
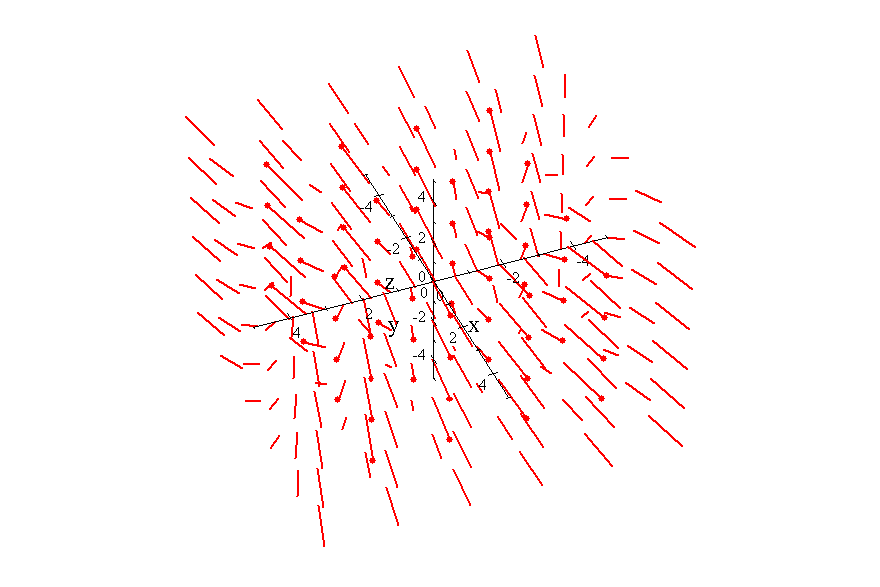
Below
are graphs, contour diagrams and gradients of several functions.
Note that:
The gradient is always perpendicular to the contours (level surfaces).
As the contours get closer, the size of the gradient increases.
For
linear functions, all the contours are parallel and equally spaced.
Also, the gradient vector is the same at every point.
|
|
|
|
The gradient of
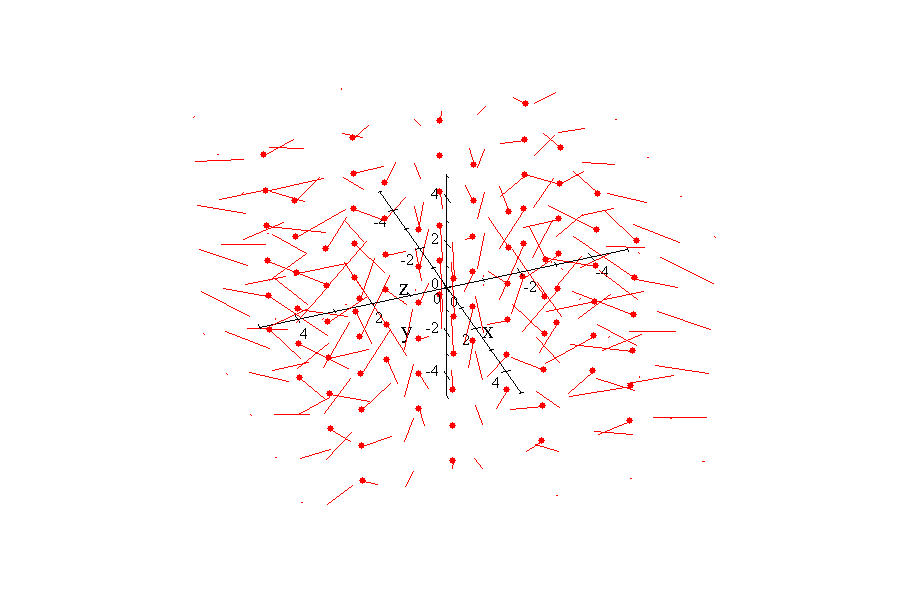
The gradient of