December 10, 2015
I wrote this explanation of how to calculate probabilities like the ones you estimated in the last homework.December 8, 2015
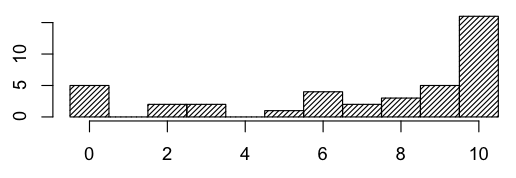
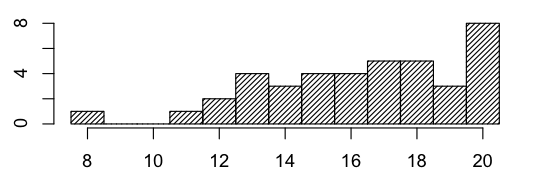
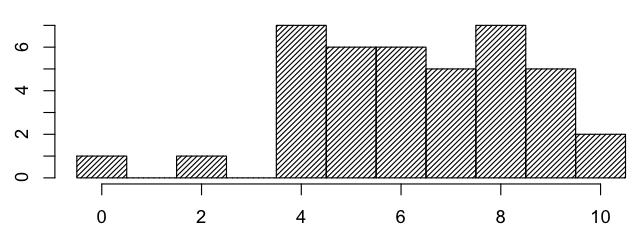
Here is a histogram of the scores from Homework 5.

November 25, 2015
With the c++ program below, the output can be sent to a csv file. When read into R with a command of the form
r1 <- read.csv(file.choose(new=FALSE),head=FALSE,sep=",")
you can then make plots of all the estimated probabilities with this R command sequence:
plot(r1$V1,r1$V2,type="o",ylim=c(0,0.6),pch=NA,ylab="probability",xlab="simulated hours")
par(new=T)
plot(r1$V1,r1$V3,type="o",ylim=c(0,0.6),pch=NA,ylab="probability",xlab="simulated hours")
par(new=T)
plot(r1$V1,r1$V4,type="o",ylim=c(0,0.6),pch=NA,ylab="probability",xlab="simulated hours")
par(new=T)
plot(r1$V1,r1$V5,type="o",ylim=c(0,0.6),pch=NA,ylab="probability",xlab="simulated hours")
par(new=T)
plot(r1$V1,r1$V6,type="o",ylim=c(0,0.6),pch=NA,ylab="probability",xlab="simulated hours")
November 22, 2015
Here is a c++ program for simulating queues using the "cut time into short, equal-length intervals" approach.
November 14, 2015
Here are the files I used for the Tour de France MDS example:
If you copy all the files to your machine and run the script doit.txt from inside R, you'll get the plot shown in class. Note that I used the wordcloud library, so you'll need to install that first.November 12, 2015
Here is a histogram of the scores from Homework 4.

November 9, 2015
Before class on Friday (11/13), please read Chapter 4 (Monte Carlo Methods) in this pdf.
November 1, 2015
Here is a histogram of the scores from Homework 3.

October 31, 2015
I have posted groups for the second project on the discussion board.
October 31, 2015
I recommend reading Chapter 7, Markov Chains, of Basic Probability Theory, by Robert Ash.
October 25, 2015
Here is a histogram of the scores from Homework 2.

October 23, 2015
Here is a reference to the lpsolve file format.
October 23, 2015
Today's MAC talk is "From Polynomials to Robots". Check it out!
October 22, 2015
Please read chapter 1 of Basic Probability Theory by Robert Ash. It provides quick coverage of the basics that we'll need.
October 20, 2015
The group project presentation schedule for the first project has changed slightly. Groups A6 and A8 have switched times.
- November 2: Groups A7, A10, A8, A9
- November 4: Groups A6, A5, A1
- November 6: Groups A3, A4, A2
October 18, 2015
I will be lecturing with pdf slides this quarter. These pdfs can be found on this Catalyst workspace site.
October 15, 2015
Here is the perl script I wrote to generate the necessary R command to solve the knight domination problem I mentioned in class.
October 13, 2015
Here is a histogram of the scores from homework 1.

October 12, 2015
Here is the group project presentation schedule for the first project:
- November 2: Groups A7, A10, A6, A9
- November 4: Groups A8, A5, A1
- November 6: Groups A3, A4, A2
Groups will present in the order listed. If time runs out, groups will be moved to the next presentation day, maintaining the overall order.
October 5, 2015
Here is an example of a worked LP problem to give you some idea of what your work should look like. Please also read the homework guidelines.
October 4, 2015
We'll be talking about these examples in class this week.
October 1, 2015
I have added a (partial) homework assignment. Check out the homework assignments link to the right.
I have also added a set of homework guidelines and suggestions. PLease read it through before starting to write up any homework.
September 23, 2015
Welcome to Math 381 A, Autumn Quarter 2015.
The course discussion board is availble (link at right). Please take advantage of it to ask questions about homework problems or course topics. You might also use it as a way to arrange study groups. I will get immediate emails when posts are added to the board, so this is as good a way to contact me as email, but allows everyone to see my response.
For those students looking for an add code, I do not overload my courses. If there are opening in the first week, you can add yourself to the course. No adds will be allowed after one week. There are no add codes.
The first homework assignment will be posted soon.